1. Look Up Your Zip Code
The fastest way to understand your home's radon risk is to check the data for your zip code. We built a free tool that pulls EPA zone data, county averages, and testing recommendations for any Georgia zip code.
Check Your Zip Code Now
Use our free tool to check radon levels by zip code. Enter your zip to see your EPA zone designation, average radon levels, and whether testing is recommended for your neighborhood.
The tool covers all Georgia zip codes and provides context about what the numbers mean. It takes about 10 seconds, and the result gives you a clear starting point for deciding whether to test your home.
Keep in mind that zip code data represents area averages. Your home could be higher or lower than the average depending on soil conditions, foundation type, and other factors we will cover below. But knowing your area's baseline risk helps you prioritize testing.
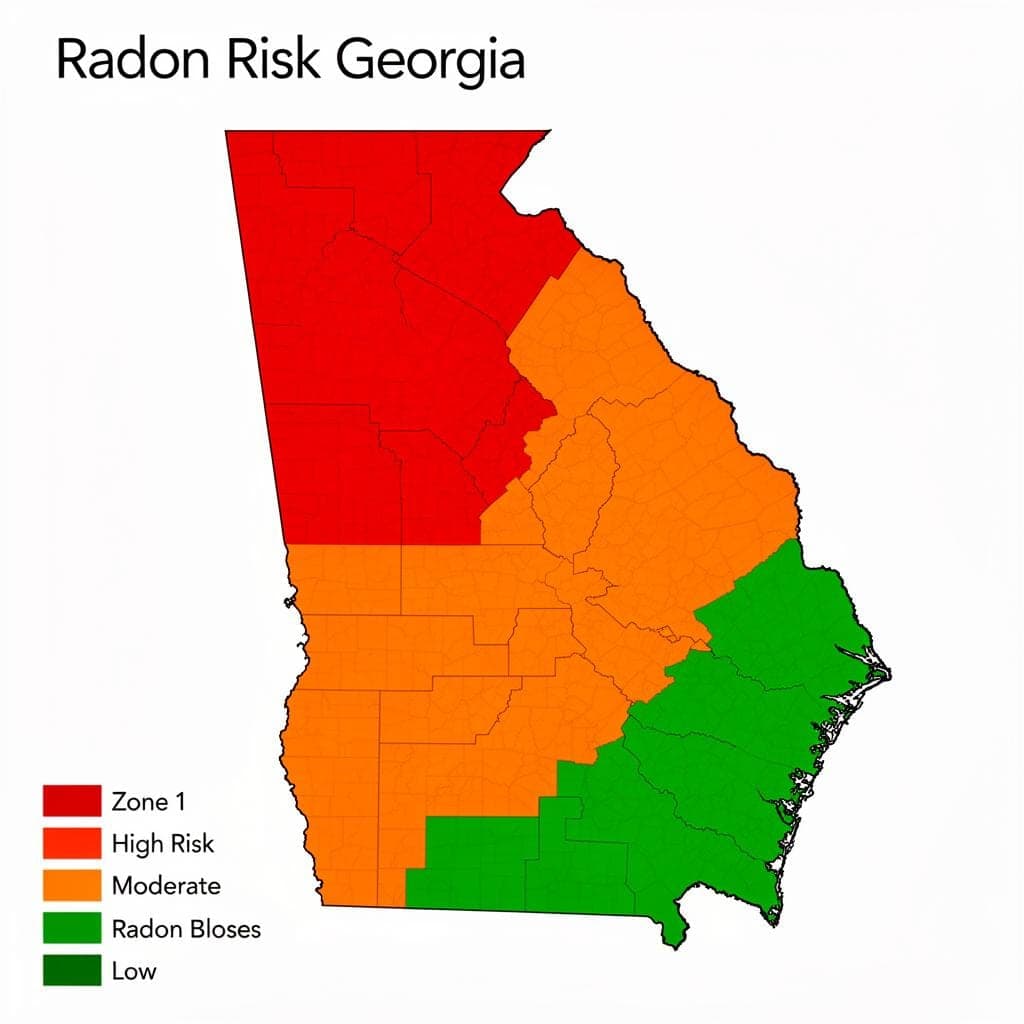
2. Understanding EPA Radon Zones
The EPA divides every U.S. county into three radon zones based on indoor radon potential. This classification system was developed from geological surveys, indoor radon measurements, and building construction data.
Zone 1 (Highest Risk)
Predicted average indoor radon level above 4 pCi/L. These counties have geological conditions that consistently produce elevated radon. In Georgia, Zone 1 covers most of the north Georgia mountains and portions of the upper Piedmont region. Testing is strongly recommended.
Zone 2 (Moderate Risk)
Predicted average indoor radon level between 2 and 4 pCi/L. These counties have mixed geological conditions. Much of Metro Atlanta falls in Zone 2, including parts of Fulton, DeKalb, and Cobb counties. Testing is recommended for all homes.
Zone 3 (Lower Risk)
Predicted average indoor radon level below 2 pCi/L. South Georgia and the coastal plain fall primarily in Zone 3. Testing is still recommended because individual homes can have elevated levels even in low-risk areas.
To see which zone your specific zip code falls in, use our check radon risk by zip code. The EPA makes clear that zone designations are not meant to replace individual home testing. They are a guide for prioritization, not a guarantee of safety.
3. Georgia's Highest-Risk Areas
Georgia's radon risk follows its geology. The granite bedrock of north Georgia contains higher concentrations of uranium, the parent element that produces radon through radioactive decay. This creates a clear geographic pattern.
North Georgia Mountains (Highest Risk)
Counties like Lumpkin, Union, Fannin, Gilmer, Pickens, and Dawson consistently show the highest indoor radon averages in the state. Many homes in these areas test above 10 pCi/L, well over twice the EPA action level. The combination of uranium-rich granite bedrock, fractured rock allowing easy gas migration, and cooler temperatures that increase the stack effect all contribute.
Metro Atlanta Piedmont (Moderate to High Risk)
The Metro Atlanta region sits on Piedmont geology with significant radon potential. Fulton County, Gwinnett County, DeKalb County, and Cobb County all have areas where homes regularly test above the 4 pCi/L action level. The mix of granite, gneiss, and schist bedrock beneath Metro Atlanta creates variable but often elevated radon conditions.
South Georgia Coastal Plain (Lower Risk)
Counties south of the fall line generally have lower radon levels due to sandy, sedimentary soils with less uranium content. However, individual homes in this region can still have elevated levels, particularly those with certain foundation types or unusual soil conditions.
4. County-Level Radon Data
County averages provide another layer of detail beyond EPA zones. Here are sample averages from key Georgia counties based on available testing data:
| County | EPA Zone | Avg. Indoor Level | % Above 4 pCi/L |
|---|---|---|---|
| Lumpkin | Zone 1 | 6.8 pCi/L | ~60% |
| Pickens | Zone 1 | 5.2 pCi/L | ~50% |
| Cobb | Zone 2 | 3.1 pCi/L | ~30% |
| Fulton | Zone 2 | 2.8 pCi/L | ~25% |
| Gwinnett | Zone 2 | 3.0 pCi/L | ~28% |
| DeKalb | Zone 2 | 2.5 pCi/L | ~22% |
| Chatham (Savannah) | Zone 3 | 0.8 pCi/L | ~5% |
These are approximations based on available testing data. Individual readings within any county span a wide range. A home in Fulton County could test at 0.5 pCi/L or 8+ pCi/L depending on its exact location, foundation type, and soil conditions. Use our look up your address for radon risk for more specific data about your area.
For a deep dive into Georgia's county-by-county radon landscape, see our complete guide to Georgia radon levels.
5. Why Radon Varies Within a Zip Code
Two homes with the same zip code can have radon levels that differ by a factor of 10 or more. This is not unusual, and it is exactly why individual testing matters more than zip code data alone. Several factors create this variation:
This is why the EPA states clearly: "All homes should be tested for radon, regardless of geography." Zip code data tells you the probability of a problem. Only a test tells you the reality.
6. What to Do After Checking Your Zip Code
After you find radon levels near you, here is how to interpret the result and decide on next steps:
Zone 1 Result: Test Immediately
If your zip code falls in EPA Zone 1, the probability of elevated radon is high. Schedule a professional test or deploy a DIY kit as soon as possible. Do not assume your home is fine because a neighbor tested low.
Zone 2 Result: Test Soon
Moderate risk means a meaningful percentage of homes in your area have elevated radon. Testing is recommended, especially if you have a basement, have never tested, or are buying or selling a home.
Zone 3 Result: Still Test
Lower risk does not mean no risk. The EPA recommends testing all homes. If you have a basement or if weather conditions in your area create conditions that could elevate radon, testing is a simple way to confirm safety.
Regardless of your zone, if you are involved in a real estate transaction, testing should be part of the process. Buyers should always request a radon test, and sellers benefit from pre-listing testing to avoid surprises.
7. Getting an Accurate Reading for Your Home
Once you have checked your zip code's risk level, here is how to get the most reliable test result for your specific home:
Whichever method you choose, test on the lowest level of your home that gets regular use. If you have a finished basement, test there. If your lowest living space is the ground floor, that is where the test goes.
If your result comes back above 4 pCi/L, use our radon mitigation pricing tool to get an estimate for your home type and understand your options. For more answers, check our frequently asked questions about radon, or visit our radon resources for homeowners.